
This is a tutorial on how to create a real time rendering system for a PFD, ND, ECAM, MCDU, LCD, or any other electronic aircraft display. This can be done two different ways:
Mesh
-Create all graphics as separate meshes.
-Place the meshes at different heights relative to each other, simulating layers.
-Render it with a separate orthographic camera into a render texture.
-Assign the render texture to the display material.
Vector graphics
-Create an SVG vector graphics file containing the graphics.
-Render the vector graphics directly into a render texture.
-Assign the render texture to the display material.
The latter is much easier to maintain, easier to animate, and much faster to render. In order to render vector graphics, a 3rd party tool called NoesisGUI is used. Unlike the name suggests, it can be used to render anything xaml based, not just a GUI. It can be found here:
http://noesisengine.com
The vector graphics can be created in a vector graphics drawing program like Inkscape, but this is not designed for precision which makes the workflow very cumbersome. I tried simply eyeballing the design using a perspective corrected photo as a background, but even with perspective and barrel distortion removed, a photograph is not accurate enough.
Instead, I decided to create an initial sketch with a CAD program. The constraint based parametric workflow is a joy to work with, and much faster and accurate than using a freehand vector based program. It is best to use QCAD as this can export a good quality SVG file. However, I already know Autodesk Inventor, so I used that to create the sketch instead.
Here are some screenshots of the CAD drawings. They only contain sketches and no solid geometry. Everything was physically measured in the aircraft so all dimensions are correct. Note that I used two different sketches because the large amount of constraints in a single sketch made the sketch unstable and slow. In addition, the ISO drawing information symbols (info box on bottom right and edge outline) are removed. This tutorial assumes the drawing is made in mm.


The CAD drawing contains no fill data, line width, colors, and layers. This will be added later using Inkscape. The purpose of the CAD drawing is just to place lines and text at the correct location.
Make sure to create a square outline in the CAD sketch because this will be used to center the drawing when imported into Inkscape.
-In Inventor, create a drawing (*.dwg) file. Part or Assembly files won’t work. On the drawing file, you can crate sketches the same way as in a part file.
-On the model tree, delete the outline (Default Border) and the info box on the bottom right (ANSI – Large).
-Create a display sketch.
Next, a few conversion steps have to be performed in order to get the CAD drawing into Inkscape:
-Go to Inventor->File->Save As->Save Copy As->DXF. Then Click Options on the save dialog, select file version AutoCAD 2013 DXF (important, otherwise the output will be corrupt if an embedded image is present). Do not select “Model Geometry Only”, otherwise the QCAD import won’t work. Delete the border and text box in the model tree instead. Now click Next->Finish and then click Save. Exporting a DXF file can take a long time if an embedded image is present.
-QCAD->File->Open (do not use Import). Select the exported DXF file.
-QCAD->File->Advanced SVG Export: select “Preserve Geometry” (to prevent text being converted to a path).
-Select Export.
Note that Inkscape can import DXF files, but this is buggy. As a workaround, QCAD is used to convert the DXF into an SVG file.
A few settings in Inkscape have to be changed to make sure the SVG coordinates are the same as in the CAD drawing. This makes it easier to make modifications.
-Inkscape->Edit -> Preferences -> Behavior -> Transforms-> Store transformation = Optimized.
-Inkscape->Edit -> Preferences -> Input / Output -> SVG Output -> Path Data -> Path string format = absolute.
-Inkscape->Edit->Preferences->Behavior->Snapping->Delay = 0.
-Inkscape->File->Document Properties->Page->General->Display Units-> mm.
-Inkscape->File->Document Properties->Page->Page size->Custom Size-> mm.
-Set the Custom Size to the size of the display and make sure it is square. For example 158, 158.
-Set the scale to 1.
-Save the file and keep a copy as a template for future designs.
-Close Inkscape, open the svg file in a text editor, and remove the translate transform of all layers (transform=”translate), caused by page resize.
Import the converted CAD drawing into Inkscape:
-Start Inkscape and open the template file.
-Open the converted CAD drawing: Inkscape->File->Import->SVG
-If part of the drawing looks incorrect, it will be fixed with ungrouping later.
-Position the drawing so it fits nicely in the middle of the viewbox. Make two guide lines and edit the location (double click on guide) so they are exactly at a corner. Then use snapping to align the outline square with the guide lines.
-Select the imported object, then go to Object->Ungroup.
-Select all, then ungroup again. Do this a few times until there are no more groups. This will also fix any incorrectly placed geometry.
Now the SVG file is ready to be modified so it looks exactly like the real display. There are a few operations which must be performed.
All lines are imported into separate path segments. If a shape needs to have a fill or if the segments need to be dynamically changed together in code, the line segments need to be stitched together. Below Is what a shape looks like when it consists of separate path segments. Note that it looks like a single segment.
Below is what the shape looks like if all individual path elements are selected. Now it is clear that it is not one single shape.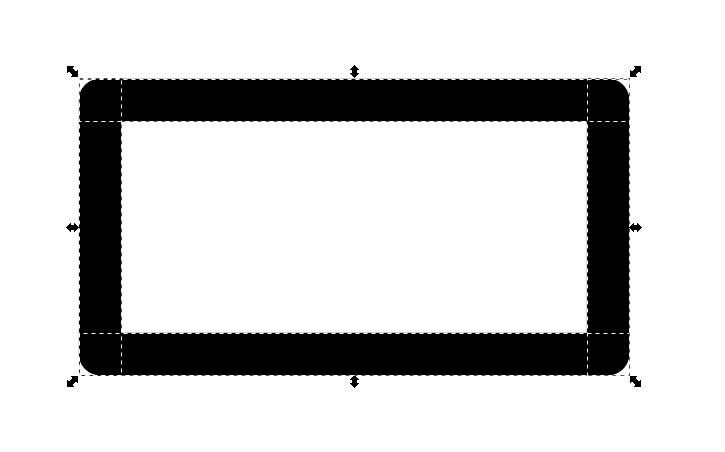
Select all individual path segments as show above. Then go to Path->Combine (or Ctrl-K). Now all segments are fused into a single object which looks like this: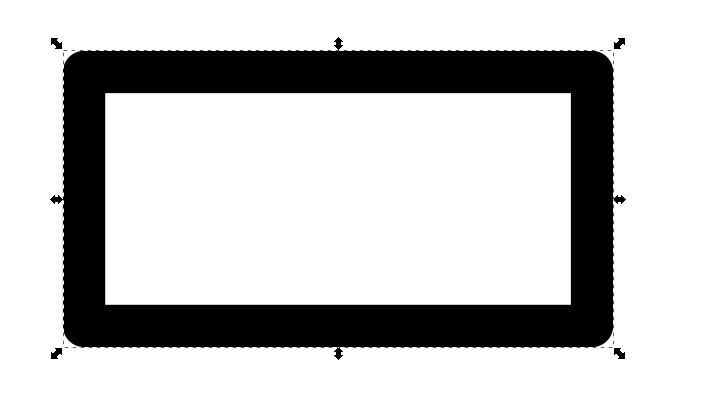
Even though the path segments are fused into a single object, is not possible to add a Fill yet. This is because the nodes of the line segments are not joined together. To do this, select the object, then select the “Edit paths by nodes” tool (icon just below arrow select tool). With the object selected, drag to select all nodes at the same time. After this operation, it is not evident that all nodes are selected, but they are. Now click on the icon called “Join selected nodes” (or Shift-J). After the nodes are joined together, the shape looks like this: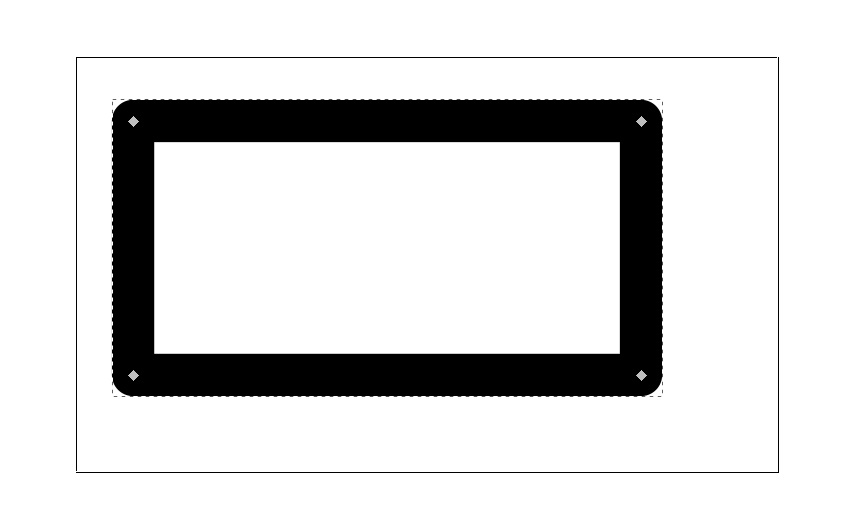
The diamonds on the corners are an indication that the join operation was successful. Now the Fill or any cutting operations work correctly.
All shapes which need to be animated in code need to have a proper ID set in Inkscape. To modify the shape ID, go to Inkscape->Select shape->Object properties->ID. Change the ID and click on “Set”.
Repeat the process for all applicable shapes. Even if a shape does not need a fill, it is still recommended to fuse path segments together where it makes sense. For example, all pitch lines for the attitude scale are fused together into one single path. This makes it easier to manage (set layers, change colors, change stroke settings, etc.) The end result should look something like the screenshot below. Note the two diagonal lines at the right. They are guide lines, used to align shapes.
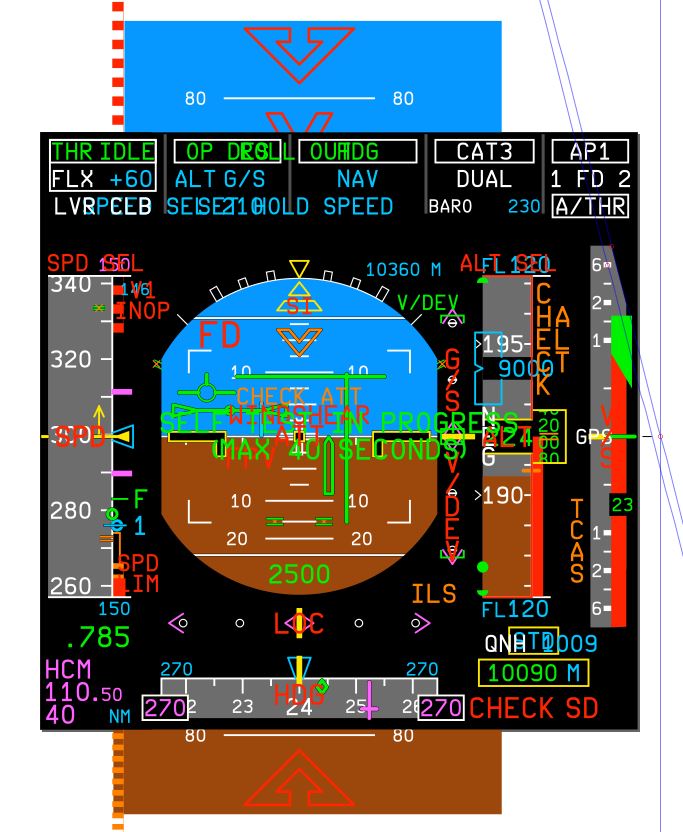
Note that the layout looks very messy. This is because all available symbols of the A320 PFD are present. The state of the symbols (color, text, number, position, etc) will be set in code (C#) at a later stage. Alternatively, you can create a copy of the SVG and delete/hide certain elements if you only want to make screenshots of certain display states.
Even if all elements are shown, it only uses two draw calls (set pass calls) in Unity, so NoesisGUI renders it very fast.
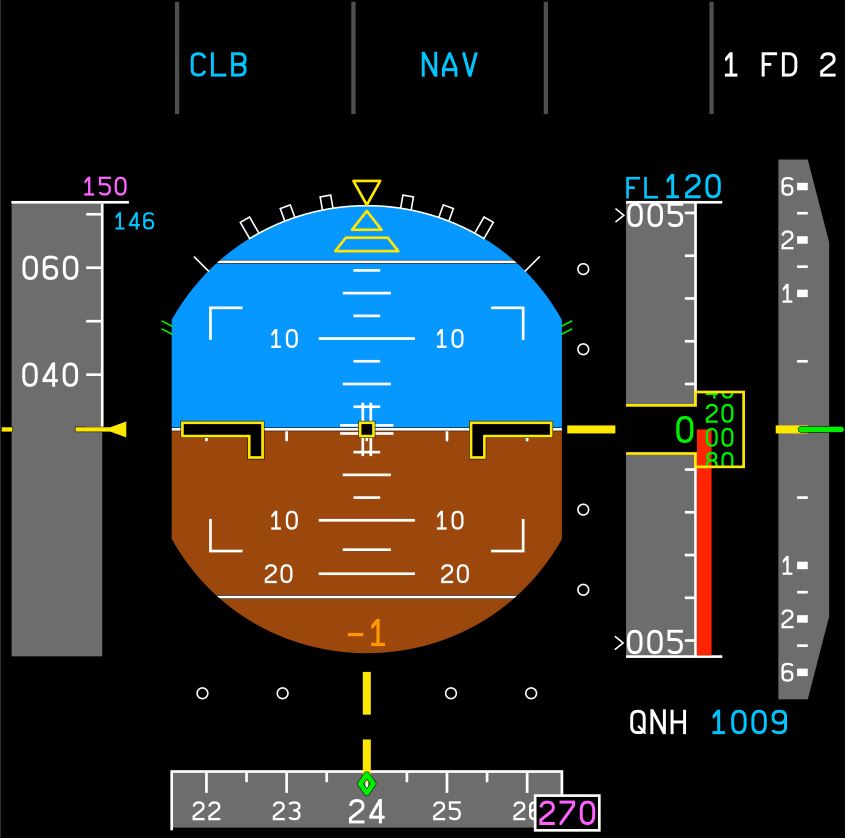
Here is a screenshot of a more realistic display state:
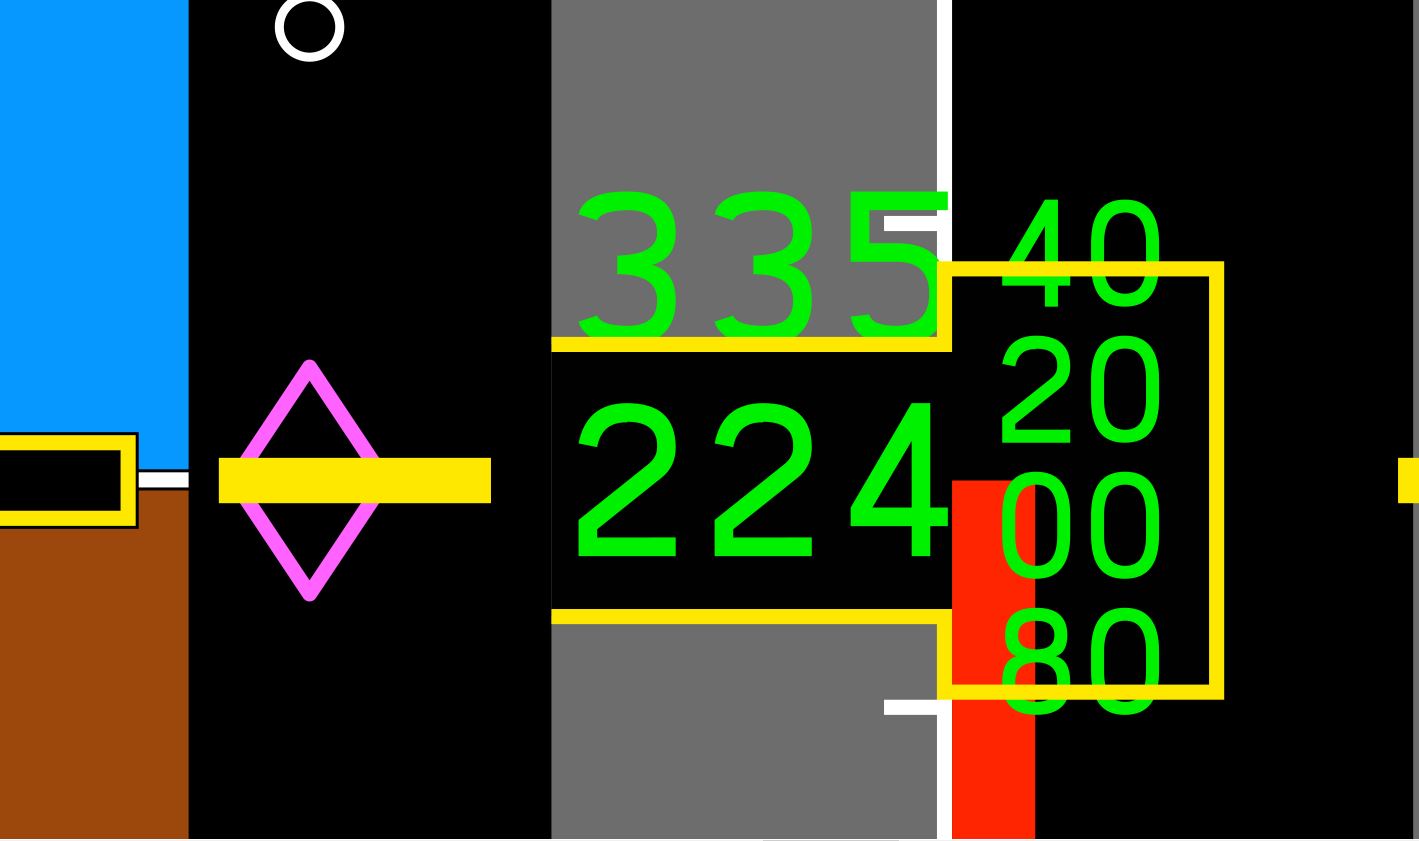
Because vector graphics are used, it is possible to zoom infinitely while maintaining quality:
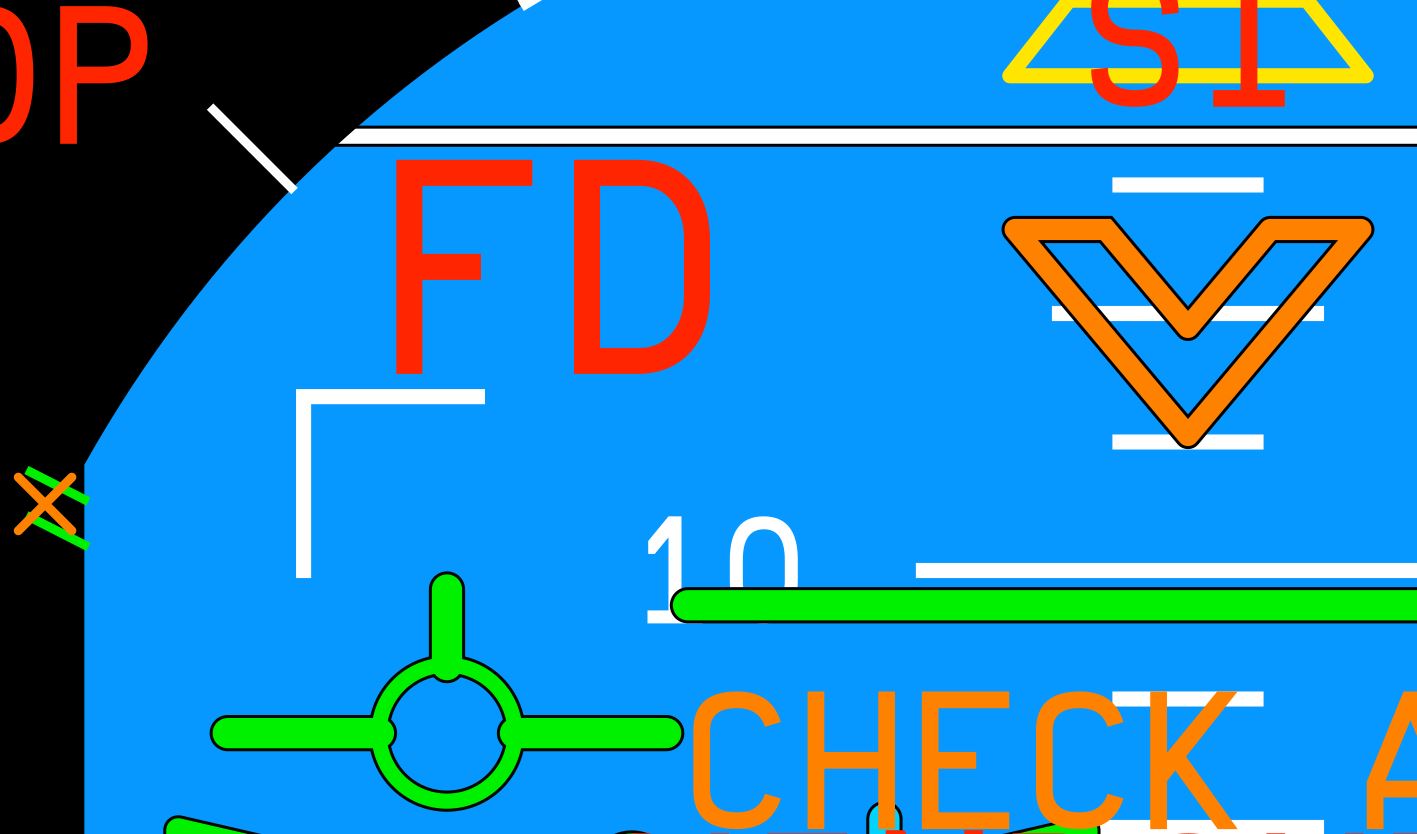
Note the small black outline on some of the symbols. This is used for added contrast, a feature which the real PFD has too. It is not possible to add an outline to a shape which does not consists out of closed line segments. So to add the black outline, a duplicate is created, the color changed to black, the stroke width set a bit bigger, and moved to a z-order just below the original. The two paths are then grouped together.
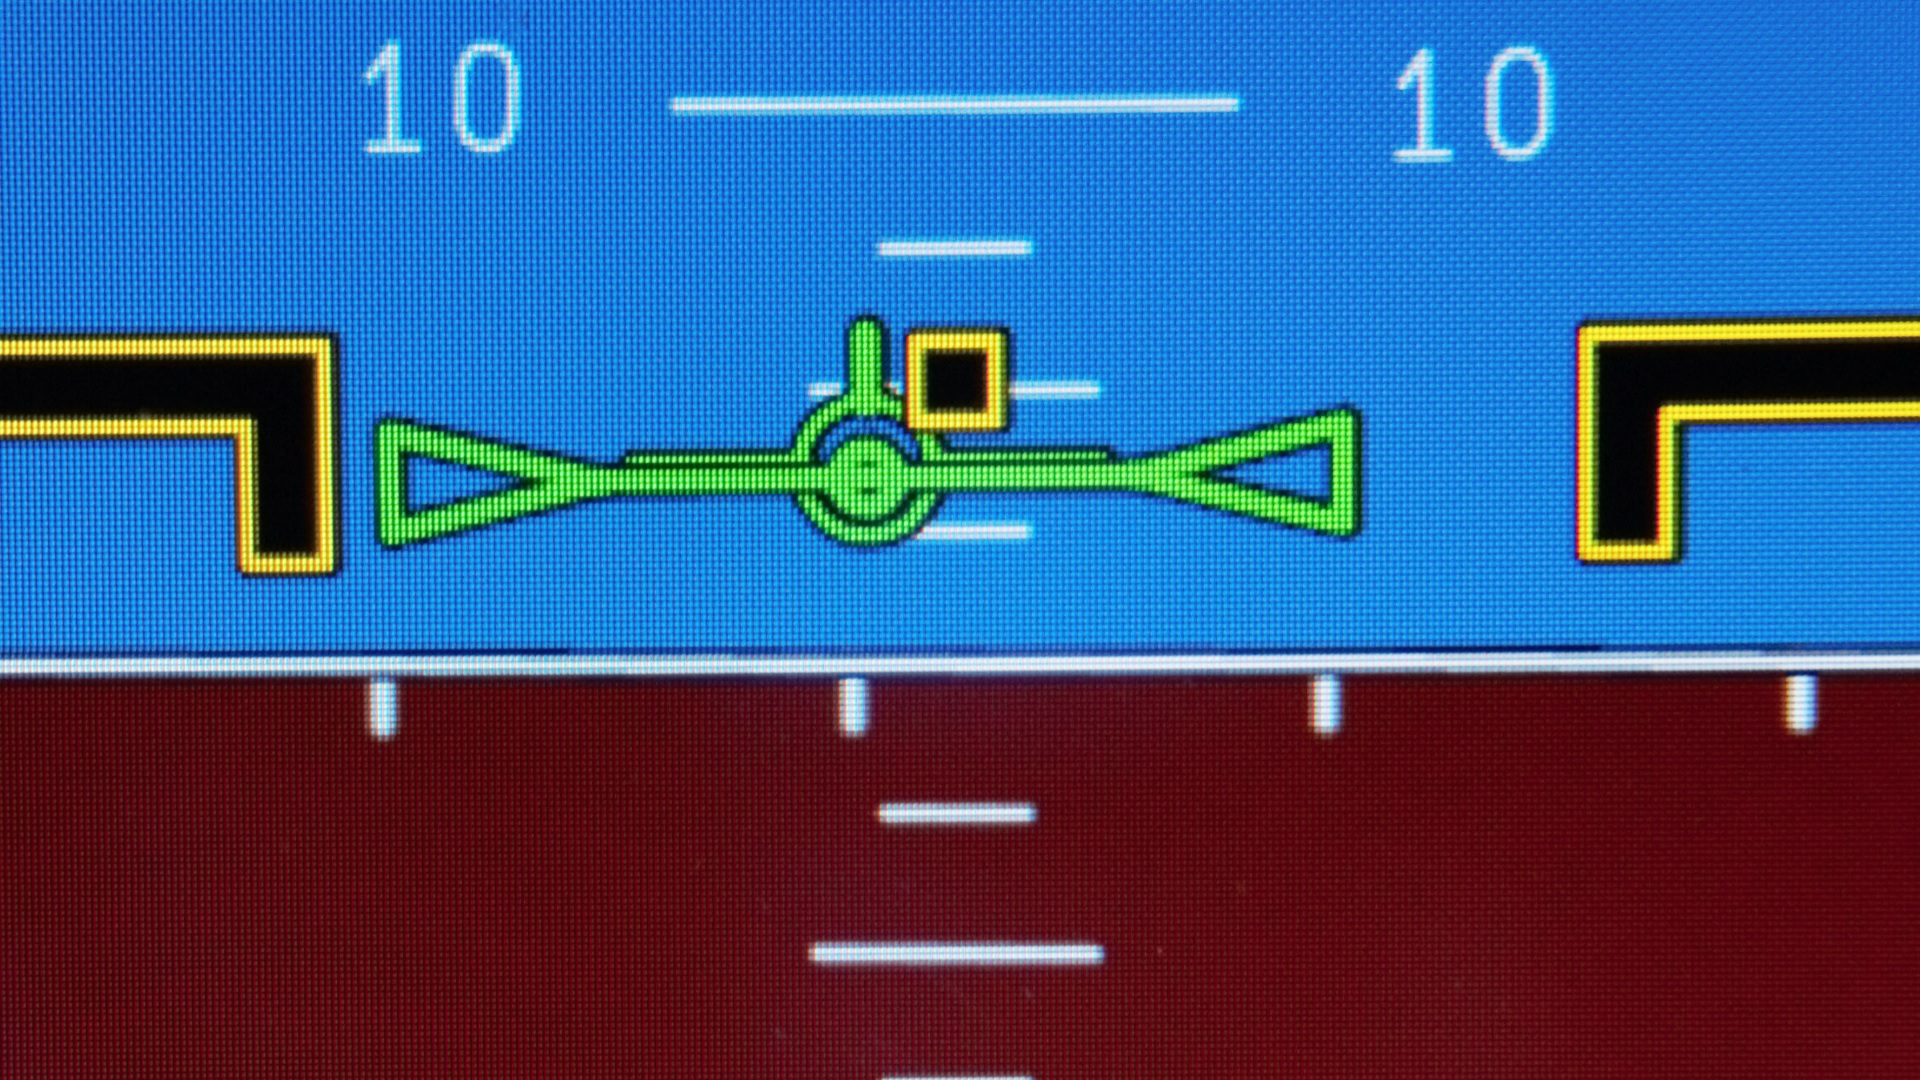
Here is a closeup photo of the real display where you can see the black contrast outlines too. Fun fact: by counting pixels and measuring the size of the display, you can figure out the resolution of the screen. It is about 768×768. Not exactly a Retina display but the size is only 158 mm square so the pixel density is quite high, especially for its time when it was designed. Right click->View Image to enlarge.
Once the display is rendered, it is not possible to zoom in with the camera and maintain visual quality, but the same vector graphics can be added to a higher resolution texture to achieve the same effect.
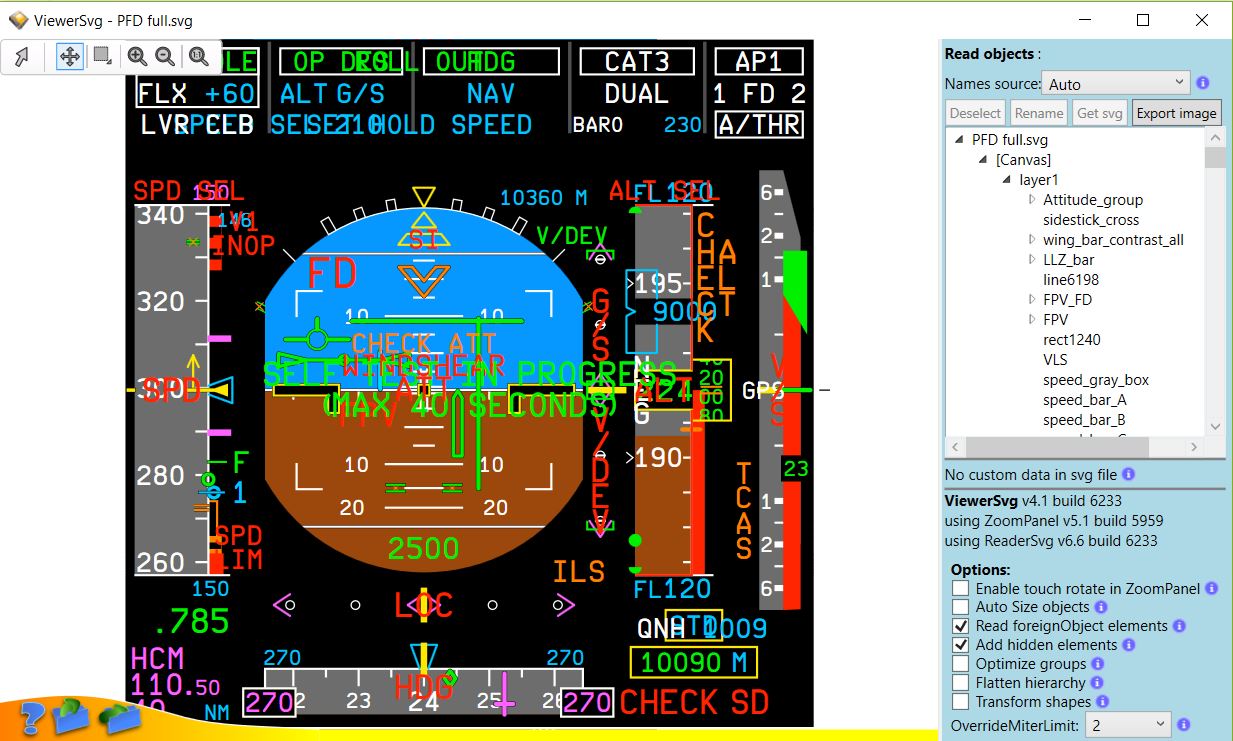
Once the SVG file is done, it has to be exported to an xaml file because this is the format used by NoesisGUI. Unfortunately the xaml exporter from Inkscape is very buggy and is unusable. Luckily there is a standalone converter available which creates high quality xaml files. It is called ViewerSVG and is available here:
http://www.ab4d.com/ViewerSvg.aspx
To convert the SVG to xaml with ViewerSVG do the following:
-Drag and drop the SVG file onto ViewerSVG.
-Select the Export icon (bottom left corner).
-On the top right corner change Target Platform to Silverlight XAML.
-On the bottom right corner change New Width to 1024 (assuming the texture you want to create for NoesisGUI is this size).
-Click on the Transform button.
-Click Save.
Now the xaml file is ready to be used by NoesisGUI. We will use Unity to render the result but NoesisGUI also has a native C++ SDK so you can use it in a different game engine.
In order to use the xaml file in Unity, do the following:
-Create new Unity project.
-Import the NoesisGUI unitypackage.
-Before adding the XAML to Unity, open it and modify all FontFamily lines so that a # character is in front of it. For example: FontFamily=”#Arial”.
-Drag and drop all fonts used in the xaml to the same directory as where the xaml file will be placed in Unity.
-Drag and drop the xaml file in the same directory as the fonts. When the xaml file is imported into Unity, it will automatically generate an asset file. This asset file is the one used by NoesisGUI, not the xaml file. Updating the xaml file will not re-import the asset file so it is best to delete the xaml file in the Unity folder.
To render the xaml to a mesh plane, do the following:
-Add a NoesisView component to the display Game Object (should be a square mesh, UV mapped correctly).
-Add the XAML asset file to the NoesisView component (not the xaml file but the .asset file which was automatically generated).
-Disable keyboard, mouse, and touch checkboxes.
-Set anti aliasing to PPAA (GPU).
-Create a render texture (no anti aliasing, and Depth Buffer set to 24 bit with stencil).
-Add the render texture to the appropriate texture slot on the material from the display Game Object.
-Press Play and check if the xaml file is rendered correctly.
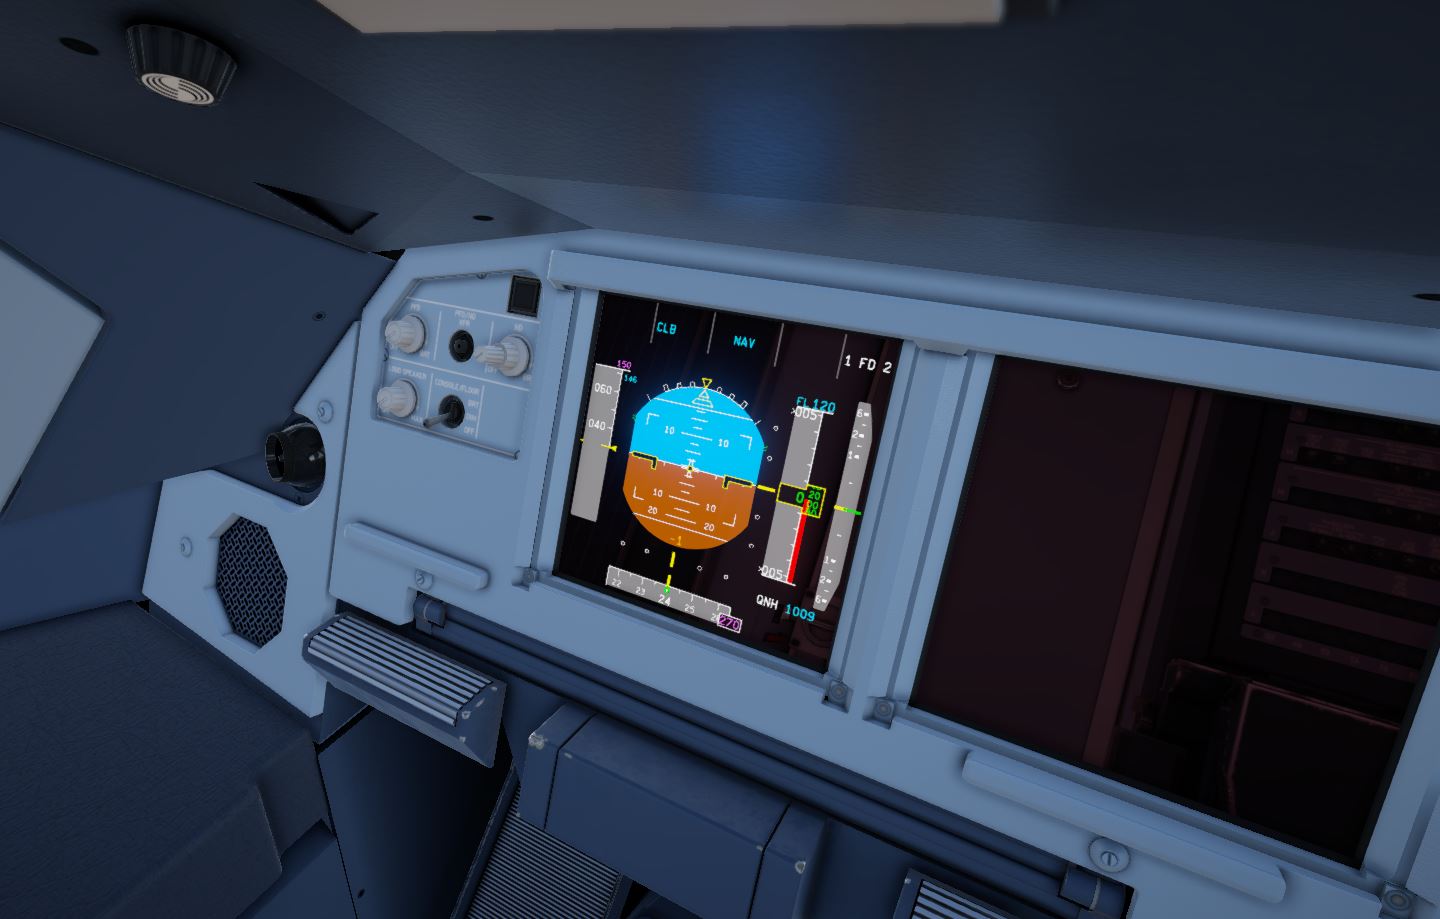
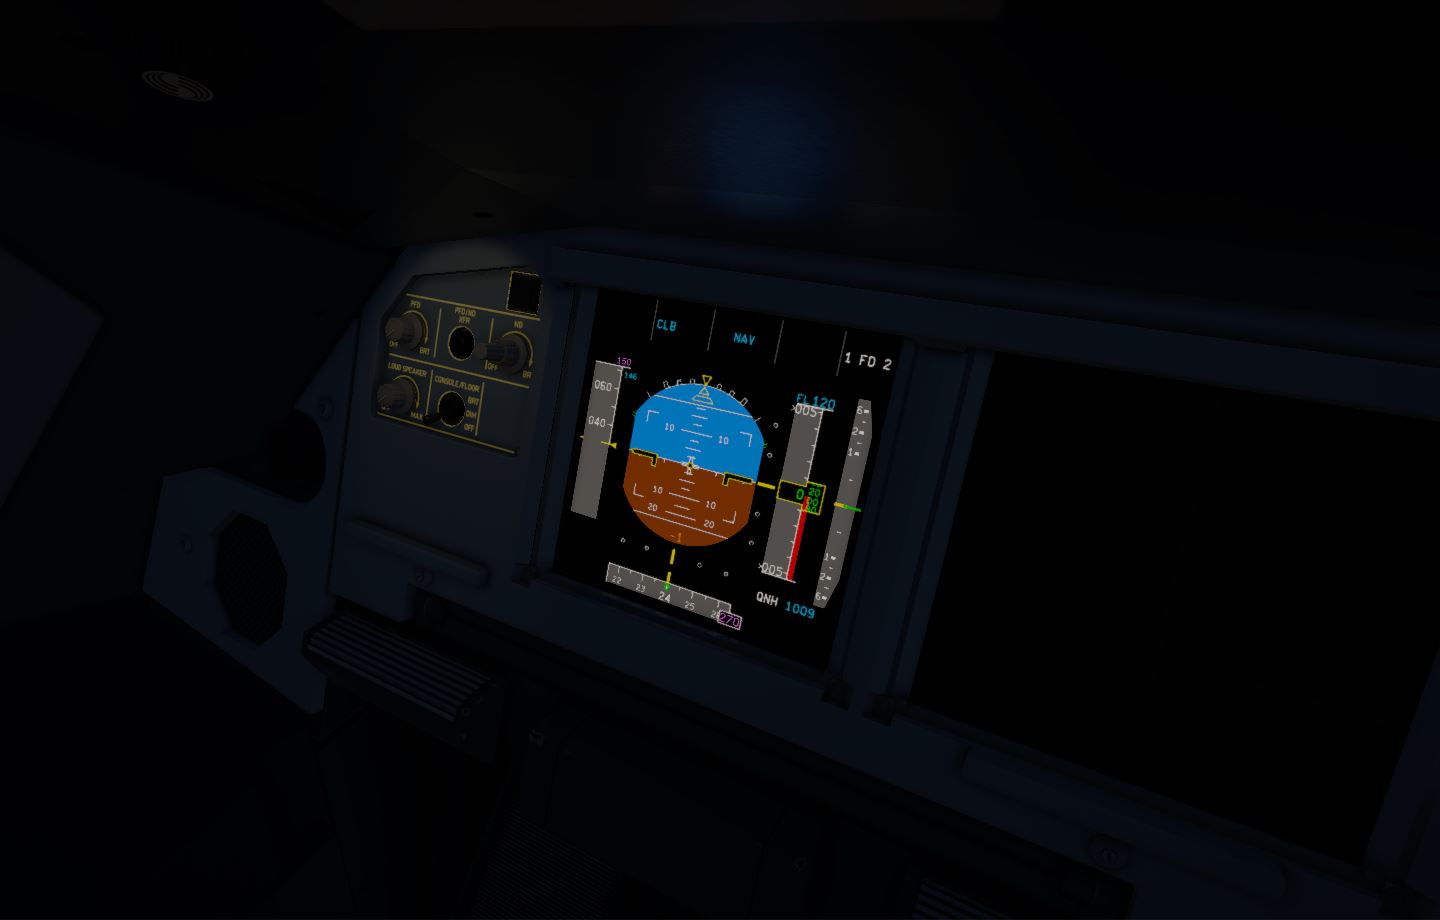
Here are some screenshots from Unity. I use the standard specular shader with a slight red specular tint to simulate the anti reflective coating. The render texture is added to the Emission slot only. The Emission color is set to gray, otherwise the display is too bright. The Emission color can be changed in code to simulate display brightness change.
The following code can be used to animate the vector graphics. The c# file has to be placed on the display Game Object.
Note that WordPress does not allow <> signs in the code, so the GetComponent() function is displayed incorrect. It should be GetComponent<NoesisView>();
Add to top of C# script:
using Noesis;
Get a handle to a path:
NoesisView panel = GetComponent();
Path obj = (Path)panel.Content.FindName("line6866");
Get a handle to a group:
NoesisView panel = GetComponent();
Noesis.Canvas obj = (Noesis.Canvas)panel.Content.FindName("g865");
Enable transformations:
RotateTransform rotateTransform = new RotateTransform();
TranslateTransform translateTransform = new TranslateTransform();
TransformGroup transformGroup = new TransformGroup();
transformGroup.Children.Add(rotateTransform);
transformGroup.Children.Add(translateTransform);
obj.RenderTransform = transformGroup;
Move a path:
translateTransform.X = 5f;
It can be hard to figure out how to precisely position items due to the scale and unit transformations caused by converting the file from SVG to XAML. The easiest way to figure out what positioning factor to use is to create a line (path) with a stroke width of 1. Then find the XAML code for that line in a text editor and copy the stroke width from there. This will be the factor to use in order to precisely position items on the canvas.
In Inkscape, the origin is at the bottom left. In XAML, the origin is at the top left. This has to be taken into account when positioning items.
If you want to get the absolute position of an element, use this code (it only works if the xaml layout has finished building, hence Content.Loaded):
NoesisView panel = GetComponent();
TextBlock text = (TextBlock)panel.Content.FindName("text7246");
panel.Content.Loaded += (s, e) =&amp;amp;gt;
{
Point pos = text.PointToScreen(new Point(0, 0));
};
Set the draw order of an element:
Panel.SetZIndex(text, 5);
Insert a new element in a specific location in the tree (affecting the draw order):
int index = canvas.Children.IndexOf(existingElement);
canvas.Children.Insert(index + 1, newElement);
In order to rotate a shape around the pivot point, a RenderTransformOrigin property has to be present in the xaml. The RenderTransformOrigin uses the range 0 to 1 and is based around 4 properties: Width, Height, Canvas.Left, and Canvas.Right. These properties must be present in the xaml shape and set to the shape bounding box. Additionally, this property has to be added: Stretch=”Uniform”. For example:
RenderTransformOrigin="0.008,0.989" Width="307.24" Height="214.098" Canvas.Left="508.8" Canvas.Top="628.8" Stretch="Fill"
When the required xaml code is present, the shape can be rotated around the pivot point using this code:
rotateTransform.Angle = 30f;
If an object has a MatrixTransform in the xaml code, you can’t use rotateTransform, otherwise you will get scaling issues. In that case use the code below. Bear in mind though that the RotateAt pivot point coordinates are absolute canvas coordinates, not in the relative 0-1 range as with RenderTransformOrigin used by rotateTransform.Angle. If you don’t want to use MatrixTransform, you need to wrap the shape or group around another group (without a matrix transform) and use rotateTransform.Angle instead.
NoesisView panel = GetComponent();
Noesis.Canvas obj = (Noesis.Canvas)panel.Content.FindName("g840");
MatrixTransform matrixTransform = (MatrixTransform)obj.RenderTransform;
Transform2 matrix = matrixTransform.Matrix;
matrix.RotateAt(0.5f, 232, 490);
matrixTransform.Matrix = matrix;
Hide a path:
obj.Visibility = Visibility.Hidden;
Set the color of a path:
obj.Stroke = new SolidColorBrush(Noesis.Color.FromLinearRGB(255, 255, 0));
Set the stroke thickness of a path:
obj.StrokeThickness = 3f;
Modify an existing path:
string dataString = obj.Data.ToString();
dataString = "M157.626,80.6264L149.626,88.6264";
//Modify the path string here.
StreamGeometry streamGeometry = new StreamGeometry();
obj.Data = streamGeometry;
streamGeometry.SetData(dataString);
Arc segments are drawn as a path with an arc data command (letter “A”). For example:
Data=”F1 M320, 484 A22, 22, 0, 0, 1, 318, 494″
Animating this is slightly more complex. According the markup documentation here, it means the following:
F1 = non-zero fill rule.
M320 = start point x.
484 = start point y.
A22 = the x radius of the arc.
22 = the y radius of the arc.
0 = the rotation of the ellipse in degrees.
0 = set to 1 if the angle of the arc should be 180 degrees or greater, otherwise set to 0.
1 = set to 1 if the arc is drawn in a positive-angle direction, otherwise set to 0.
318 = end point x.
494 = end point y.
In order to draw a round arc segment (circle instead of ellipse), the x and y radius values must be the same. When animating the arc, you need to calculate the start or end point. This can be done using trigonometry. Let’s say we are animating the APU EGT gauge arc segment. Using Microsoft Blend for Visual Studio we can easily experiment with an xaml file. Looking at the code is appears that the start point is the bottom right of the arc, so we need to change the end point in order to animate the arc (note that Cos and Sin functions require angles in radians, not degrees.
First calculate the arc center (only needs to be done once). The easiest is to just get it from your CAD source. If you need to calculate it, it can get a bit complex, as is described here (note: if the blog fails to load, copy paste the link and download as pdf here). When the arc center is known, the circle end point can be calculated using the known radius (22 in the example) and the given angle.
endPointX = radius * Cos(angleRadians) + arcCenterX
endPointY = radius * Sin(angleRadians) + arcCenterY
Cloning an existing path is described below. This requires all relevant properties to be copied. Only Fill, Stroke, and StrokeThickness are shown here:
Path obj2 = new Path();
obj2.Data = obj.Data;
obj2.Fill = obj.Fill;
obj2.Stroke = obj.Stroke;
obj2.StrokeThickness = obj.StrokeThickness;
Noesis.Canvas canvas = (Noesis.Canvas)panel.Content.FindName("layer1");
canvas.Children.Add(obj2);
Create a path which can be drawn using commands instead of a string (does not draw anything yet):
Noesis.Canvas canvas = (Noesis.Canvas)panel.Content.FindName("layer1");
Path shapePath = new Path();
shapePath.Stroke = new SolidColorBrush(Colors.Green);
shapePath.StrokeThickness = 1;
StreamGeometry streamGeometry = new StreamGeometry();
streamGeometry.FillRule = FillRule.EvenOdd;
shapePath.Data = streamGeometry;
canvas.Children.Add(shapePath);
Draw a path using commands instead of a string:
using(StreamGeometryContext ctx = streamGeometry.Open())
{
ctx.BeginFigure(new Point(10, 90), true);
ctx.LineTo(new Point(20, 90));
ctx.ArcTo(new Point(60, 60), new Size(new Point(10, 10)), 0, false,
SweepDirection.Counterclockwise);
}
Change text:
TextBlock fdText = (TextBlock)panel.Content.FindName("text7246");
fdText.Text = "ABC";
Show/hide text:
TextBlock fdText = (TextBlock)panel.Content.FindName("text7246");
fdText.Visibility = Visibility.Hidden;
fdText.Visibility = Visibility.Visible;
Change text color:
TextBlock fdText = (TextBlock)panel.Content.FindName("text7246");
fdText.Foreground = new SolidColorBrush(Noesis.Color.FromLinearRGB(255, 255, 0));
Add xaml code from another xaml file:
NoesisView panel = GetComponent();

Noesis.Canvas root = (Noesis.Canvas)panel.Content.FindName("layer1");
Noesis.Canvas xaml = (Noesis.Canvas)Noesis.GUI.LoadXaml("Assets/file1.xaml");

//Place new xaml content in current xaml.
root.Children.Add(xaml);
Replace the entire xaml file with another xaml file by using Resources.Load():
The xaml file which has been converted to an .asset file has to be placed in a folder called Assets/Resources. The file is then referenced in the Resources.Load() function without the extension. For example “Assets/Resources/file1.asset” becomes “file1”.
NoesisView panel = GetComponent();
NoesisXaml xaml = (NoesisXaml)UnityEngine.Resources.Load("file1", typeof(NoesisXaml));
panel.Xaml = xaml;
panel.LoadXaml(true);
Replace the entire xaml file with another xaml file by using a public variable:
//Drag and drop the xaml file on the Inspector from the script.
public NoesisXaml xaml;

//At Start() function:
NoesisView panel = GetComponent();
panel.Xaml = xaml;
panel.LoadXaml(true);
Note that the Back Up Speed Scale (BUSS) is also present but hidden to prevent clutter. Just do a text search for BUSS and you can enable the code manually.
All shapes, text, and groups, have an appropriate ID so you can find them easily.
The green altimeter numbers are hidden by a mask so you can animate them without having to worry about overdraw. The big numbers are called altLeftA, altLeftB, altMidA, altMidB, altRightA, altRightB. Not all numbers can be seen in the original SVG file because of the clipping mask but they are still there. Here is a screenshot with the clipping mask removed, revealing some hidden numbers.
In order to animate the speed, altitude, and heading bar, simply move the index notches and numbers, change a number when it is out of view, and re-position it accordingly.
To animate the Vertical Speed needle, change the start and end point of the line and underlying black contrast shape. Do not use rotate and scale as that can lead to unexpected results. The VS needle only goes to 6000 fpm and then stops. Any higher value is only visible in the VS number box. Near the VS needle is a line called “VSreference”. The right point of the line is the virtual pivot point of the VS needle. So any VS needle deflection must be drawn between that point and the current VS value. The line should only start drawing at the edge of the screen though.
The black outline used on some objects to increase contrast can cause aliasing at low resolution. In that case it is best to disable them.
Note that the attitude pitch angle scale is not linear and this has to be taken into account when setting a pitch angle.
If you want to explore different layers and groups, it is best to do this via the build in Inkscape XML editor because clicking on objects and groups in the viewport can be troublesome.
The rising runway symbol to be moved is a group called RISING_RWY_MOVE.
Note that flowed text is not supported by ViewerSVG. QCAD creates regular text from imported CAD drawings but if you create text inside of Inkscape, do not drag to make a text box. Instead just select the text tool, click, and type. This creates regular text which does not create any problems.
Another text type that can cause problems (incorrect placement) is a “tspan” element. These elements are not created when text created in CAD is imported but it is created when text is created or duplicated inside of Inkscape. To prevent any placement errors, delete all tspan elements. To do this, close Inkscape and edit the svg file in a text editor. Use a regular text element (without tspan) as an example.
Post me a mail or post a comment if you have any questions.

Leave a comment